It’s not just about making money, it’s holding onto it
The recently released BofA Merrill Lynch Global Fund Manager Monthly Survey shows fund managers’ overweight position in global equities at 19%; viewed in isolation this suggests a positive outlook, but this number reflects a fall from 33% the previous month to the lowest weighting in equities since November 2016. This data can support either the positive or negative case for equities:
The positive argument, which has worked for close to a decade, is that markets climb a ‘wall of worry’; if the collective investment community has already sold equities then their next move will be to buy them back. This assumes an opportunity cost to not holding equities and a natural inclination towards holding equities over the longer term.
The less rosy view is that fund managers spend their lives judging market risk and reward, and that a large group of them view the reward as insufficient for the possible risk, more so now that central bank support is fading. Some, though not all, will sell again when they feel that momentum has swung to a more negative mood.
Either way, there’s a growing view that we are heading towards something ranging from a shallow recession to a market blow-up along the lines of 2008. We have no way of telling when markets will fall, by how much, or even how much higher they might go before a fall. However, we did take the view back in May that the potential risk to capital preservation warranted reducing risk across our portfolios.
Our investment philosophy
When we construct portfolios, we spend a great deal of time selecting funds that, when combined, produce robust portfolios that track a steadier path than the underlying markets. The aim is to avoid the worst of the price swings and achieve greater wealth over the longer term. Here are a couple of charts, and a few numbers, that encapsulate how we’re achieving this, using our popular income model as an example.
Long-term performance
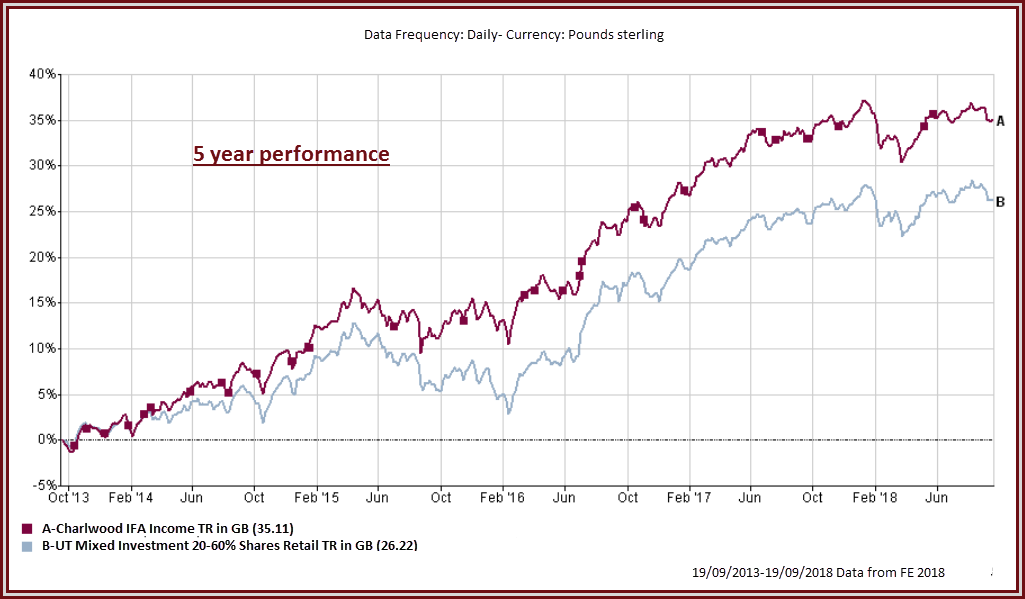
Over the past five years the fund has out-performed its benchmark by just short of ten percentage points; the annualised growth rate is 6.5% (although past performance is no guarantee of future performance):

More reward for less risk
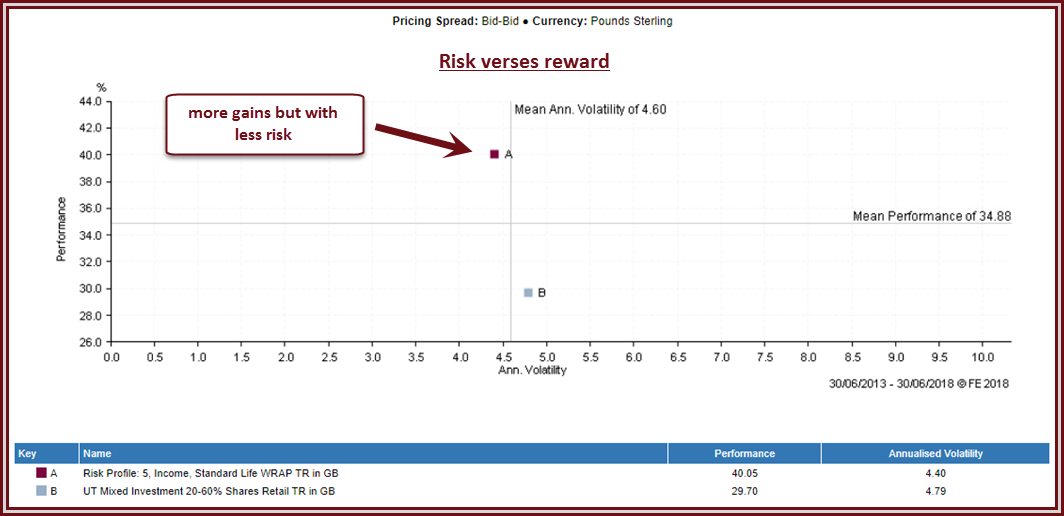
Now, it could be argued that markets have mostly been rising over that period, so all we had to do was take more risk than the benchmark in order to out-perform, which brings me to the next chart:

The above chart is really a very simple one; it plots the performance over the past five years against the amount of risk taken to achieve it (please note that the numbers differ to the previous chart because these data can only be taken to the last month end). The chart shows that our income fund had a better performance than the benchmark (it’s higher up the chart) but that it had taken less risk (it has a lower volatility number than the benchmark).
Holding onto the gains we make
The final point contains a bit of jargon, but please bear with me as it’s a great illustration of what we aim to achieve:

The above numbers mean that, on average over the past 5 years, when the benchmark rose, our income fund captured 105.02% of the gains (i.e. if the benchmark rose by 10% then, on average, our fund rose by 10.5%); when the benchmark fell, our fund only fell by 74.67% of the benchmark’s fall (so if the benchmark fell by 10% then our fund fell by 7.5%).
This philosophy has produced a similar pattern across our risk models:
- All models are ahead of benchmark over five years,
- All models have used less risk than the benchmark in achieving superior returns
- All models have, on average, fallen by less than the benchmark during market falls,
- All, bar one, models have, on average, risen by more than the benchmark during market rises.
To be fair, there will be times when a more cautious approach means that we might not capture all the upside because the priority will be on limiting losses and preserving your capital.
Hopefully, this article will leave you comfortable that your wealth is in safe hands and allow you to concentrate on enjoying your holidays.

